Figure
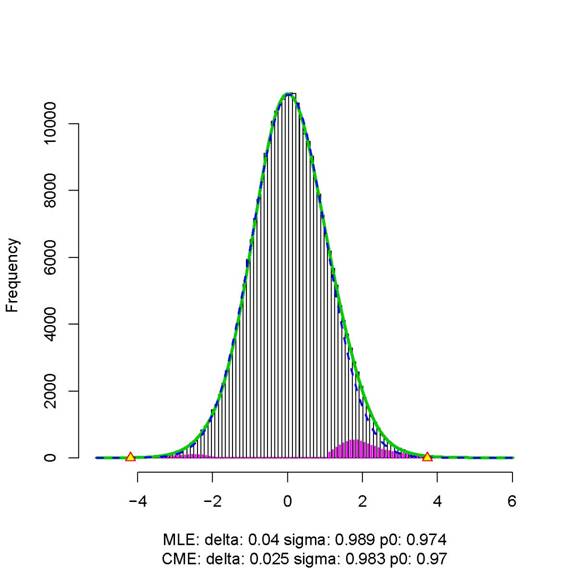
3. The plot produced by
the locfdr function for the real data. Again, the green curve represents the
fitted mixture density (fitted with 14 df) and the
dashed blue line represents the estimated null density.
Figure
3. The plot produced by
the locfdr function for the real data. Again, the green curve represents the
fitted mixture density (fitted with 14 df) and the
dashed blue line represents the estimated null density.